This is Table 12 from a Metro document titled REGION 2040, Recommended Alternative, Technical Appendix, September 15, 1994.
Metro said that this document is not available on the internet.
|
|
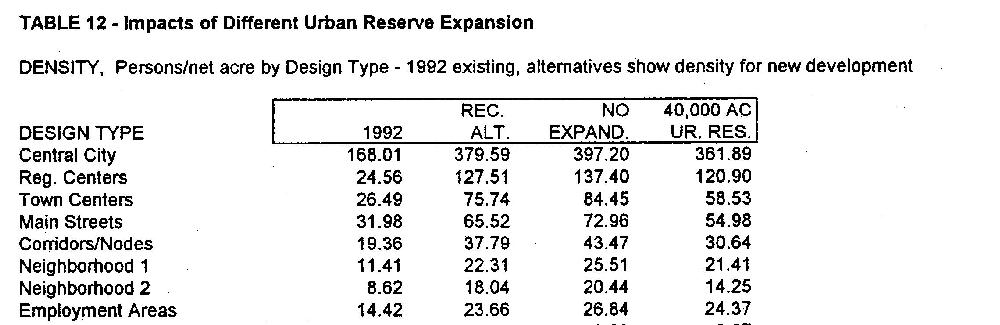
| I asked Metro for data as to the current regional densities. They had none. Instead they gave me this computer estimated chart from 1994. This part of the chart was described a being reliable, while the portions below it were described as less reliable. That is why we only show this portion. The link below will give the whole chart, including the alleged less reliable data, in TIF format suitable for high quality printing. | |
| The above chart is the best that Metro could supply for regional densities
when Metro started it's densification plan. This is Table 12 from a Metro document titled REGION 2040, Recommended Alternative, Technical Appendix, September 15, 1994. Metro said that this document is not available on the internet. |